Graphs and Art
After increasing about three-fold between 1950 and 2000 at an average rate of about 2.3% per year, total US energy consumption peaked in about 2000 at around 100,000 trillion BTUs and has been flat for about the last two decades. And over that 20-year period, US real GDP has increased by almost 50%! CO2 emissions in the US over the next decade are expected to continue a downward trend that started in 2007, and by 2030 will fall to the lowest level since 1986 and 22% below the 2007 peak.

US energy production as a share of energy consumption topped 100% for the first time since 1956 as America was actually a net energy exporter for the first time in more than 60 years. In 2005 the US produced less than 70% of its energy consumed as the country’s energy self-sufficiency reached an all-time low.

Japanese artist Kumi Yamashita winds a single black thread around a grid of nails on a wooden board to create intricate portraits.

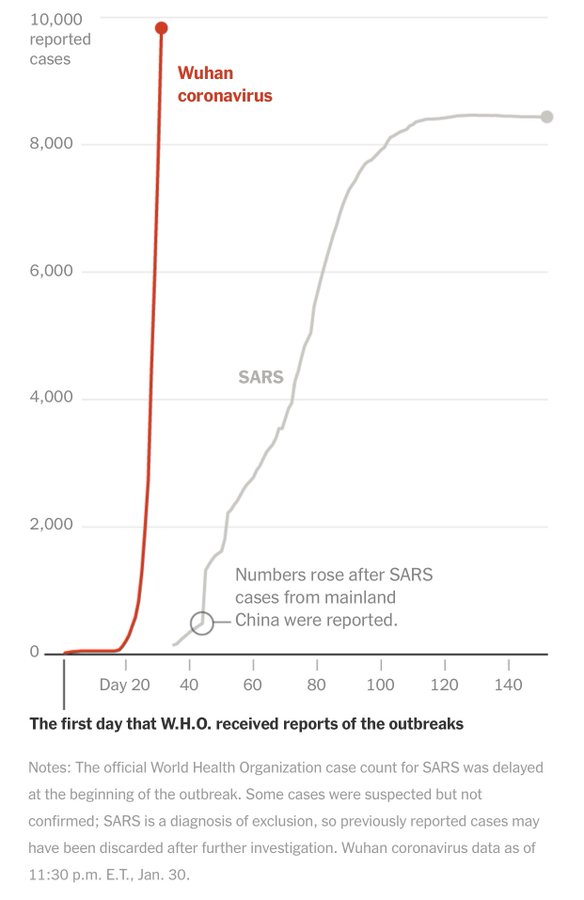
The Coronavirus is less lethal but more communicable than SARS.

No comments:
Post a Comment