Graphs
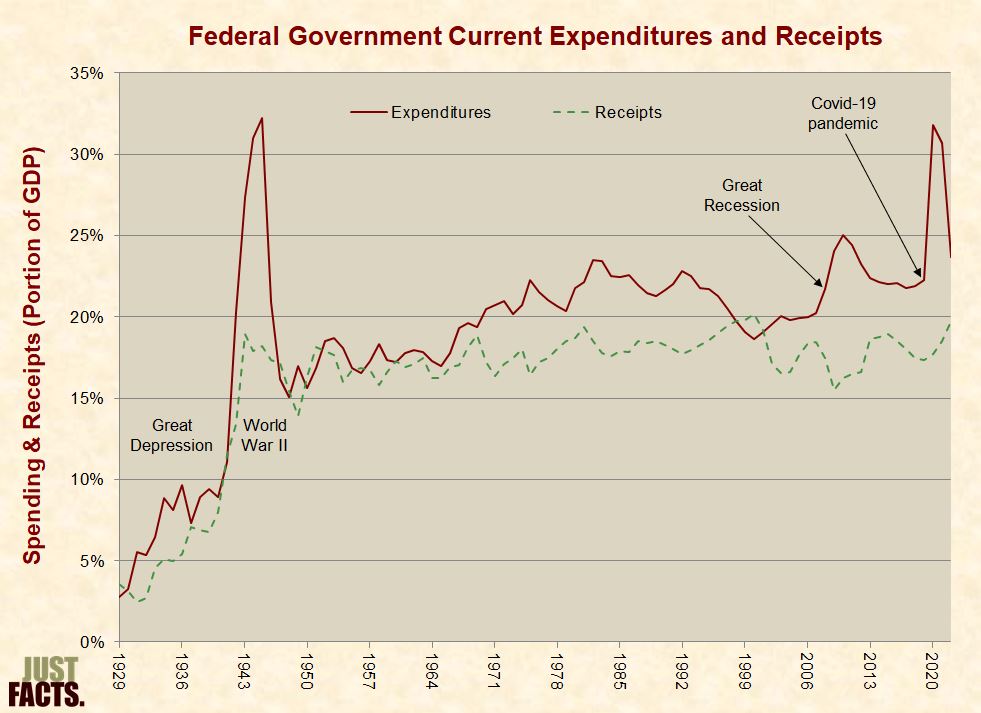
From 1929 to 2019, federal government current expenditures and receipts—expressed as a portion of gross domestic product—have varied as follows:
From 1962 to 2019, interest payments on the national debt as a portion of federal revenues ranged from 9% to 27% per year, with both the median and average being 17%:

From 1960 to 2018, the portion of government outlays consumed by various measures of social spending increased by 1.9–3.0 times:

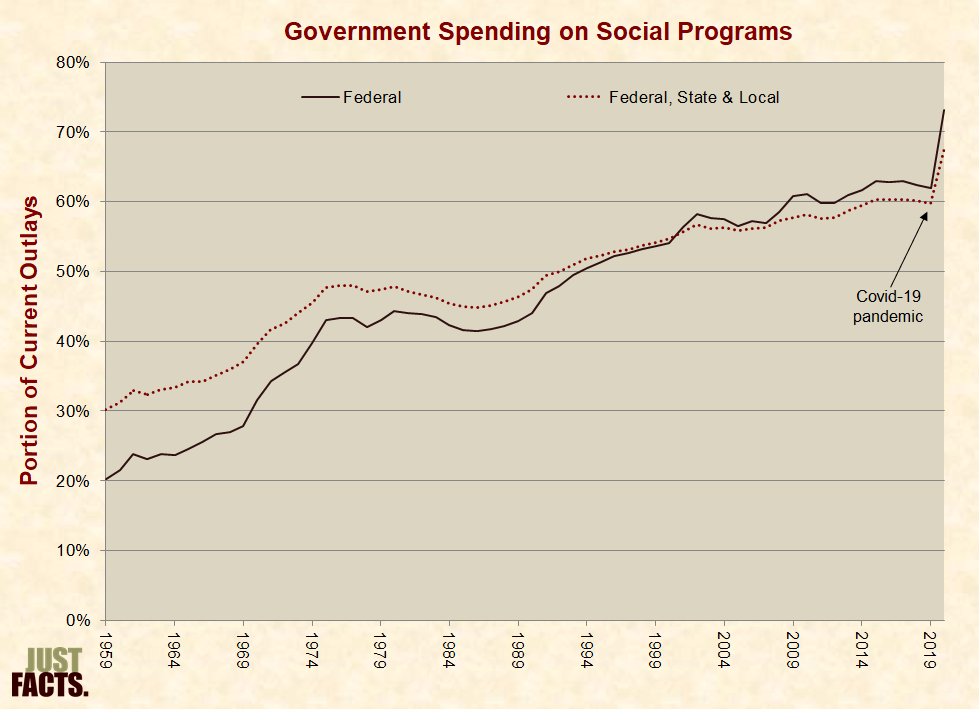
From 1959 to 2017, spending on social programs increased from:
- 20% of all federal outlays to 62%.
- 30% of all federal, state, and local outlays to 60%:
No comments:
Post a Comment