SatStats
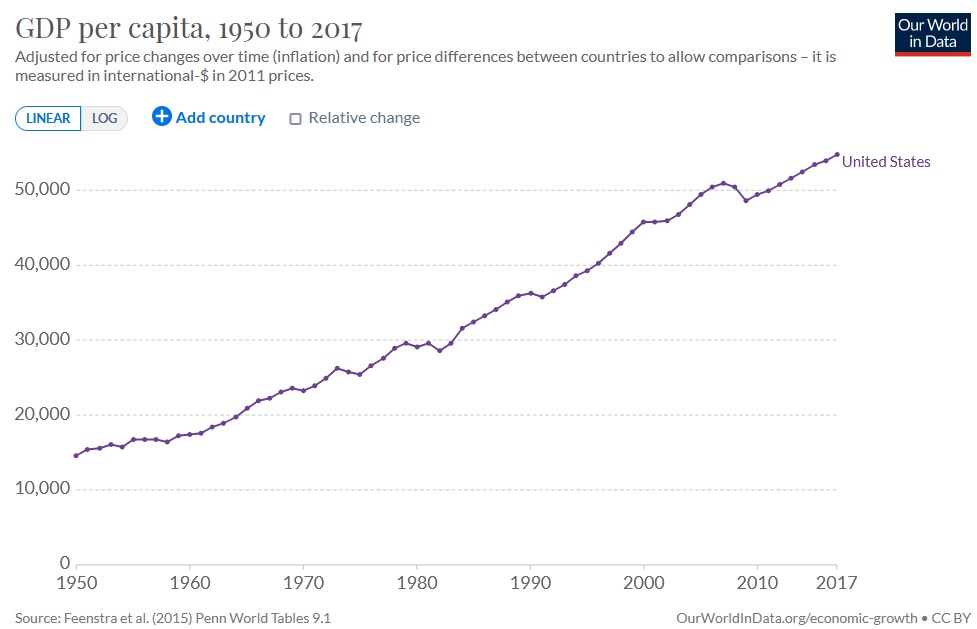
Chart of inflation-adjusted per-capita economic output in the United States, which comes from Oxford University’s Our World in Data.
Chart of inflation-adjusted per-capita economic output in the United States, which comes from Oxford University’s Our World in Data.
The obvious takeaway from this data is that Americans are much richer today than they were after World War II. Adjusted for inflation, we’re now about four times richer than our grandparents.
Back in 1997, Micahel Cox and Richard Alm wrote an article for the Dallas Federal Reserve Bank’s Annual Report.
Here are some of their findings.
What really matters…isn’t what something costs in money; it’s what it costs in time. Making money takes time, so when we shop, we’re really spending time. The real cost of living isn’t measured in dollars and cents but in the hours and minutes we must work to live. …A pair of stockings cost just 25¢ a century ago. This sounds wonderful until we learn that a worker of the era earned only 14.8¢ an hour....
In calculating our cost of living, a good place to start is with the basics—food, shelter, and clothing. In terms of time on the job, the cost of a half-gallon of milk fell from 39 minutes in 1919 to 16 minutes in 1950, 10 minutes in 1975, and 7 minutes in 1997. A pound of ground beef steadily declined from 30 minutes in 1919 to 23 minutes in 1950, 11 minutes in 1975, and 6 minutes in 1997. Paying for a dozen oranges required 1 hour 8 minutes of work in 1919. Now it takes less than 10 minutes, half what it did in 1950.

No comments:
Post a Comment