Showing posts with label statistics. Show all posts

Friday, September 12, 2025

Three Maniacs Walk into a Bar


On this day:
490 BC
Battle of Marathon: The conventionally accepted date for the Battle of Marathon. The Athenians and their Plataean allies, defeat the first Persian invasion force of Greece.
1213
Albigensian Crusade: Simon de Montfort, 5th Earl of Leicester, defeats Peter II of Aragon at the Battle of Muret.
1683
Austro-Ottoman War: Battle of Vienna – several European armies join forces to defeat the Ottoman Empire.
1846
Elizabeth Barrett elopes with Robert Browning.
1857
The SS Central America sinks about 160 miles east of Cape Hatteras, North Carolina, drowning a total of 426 passengers and crew, including Captain William Lewis Herndon. The ship was carrying 13–15 tons of gold from the San Francisco Gold Rush.
1940
Cave paintings are discovered in Lascaux, France.

***

"The Supreme Court blocked me; it will not stop me."--Joe Biden. Is that threatening a constitutional crisis?

***

911 yesterday marked a significant national threat from a tiny external group. The Kirk murder is an internal threat by an individual. It is, like the external threat, a serious threat.
Strangely, both threats are marked by bravado. 

***

In NYC, 63 people are responsible for 5000 arrests.

***

CMU is advertising on Gutfield.

***


Three Maniacs Walk into a Bar

In 2023, about 869,000 hourly workers —1.1% of all hourly workers — earned at or below the federal minimum wage, the lowest in history. Slightly less than 50% of them are aged 16 to 24. In the largest study ever done on homosexuality in the Western world, 0.7% of women and 1.4% of men admitted to having at least one (and some only one) episode of homosexual physical contact (kiss and/or caress included) in their entire adult lives.

Why is it that such small parts of our population --and such peripheral parts of the bell curve--demand such a disproportionately large part of society's time, attention, and energy? In a culture such as ours with economic problems, unemployment, drug use and crime, broken homes with fatherless children, endless and pointless wars, and general malaise and philosophical uncertainty, it cannot be that we have no more important projects to focus upon.

One would hate to think these small problems are the result of pointed, self-absorbed special interests or, worse, insincere political distraction from the bigger and more difficult problems.

Except for one thing: maniacs who stalk and kill strangers. How many maniacs does it take to ruin a society? It used to be that the destructive, homicidal maniac was royalty, whose poor subjects believed had a divine right to harm or kill them for his greater cause. Now that maniac is a poor brand of us. 

For perspective, look at IQ. If IQ tests are collected and analyzed, a curve will develop, composed of the collected scores. 100 is the average, the norm. About 68% of scores will cluster between IQs of 85 to 115. One deviation. About 95% will cluster in the 70-130 range. Two deviations. So about 2.5% will have IQs over 130 and 2.5% below 70. That is a rarified group. But if that group is a subset of the larger population of 350 million people--and that subset is morons and maniacs--that's a lot of maniacs and morons. 8.75 million.

On the edge of the bell curve. Is two standard deviations off the mean enough? Or should it be three standard deviations? That's only 0.1% but among 350 million, that's 350,000 maniacs, most with gun ownership rights. And this doesn't include the simple criminal or the desperate addict. Or the ideologically bent. And two standard deviations is a lot more. 

And, of course, there is the frightening undercurrent: the fear that the peripheral is bleeding into the mainstream. Is the guy who killed Kirk part of an early guerrilla movement? Or are these guys too crazy to organize?

A norm of death, fear, and chaos. Lunatics following the blueprint of the Heroes of Beslan. What's hard to understand is why the Left isn't as alarmed as the Right. Maybe civilization isn't as high on their list.

A Bell Curve:


Wednesday, January 31, 2024

Surveys

Social Security is running out of money, and doing nothing will result in a 23% cut to benefits within a decade. The retirement trust fund, according to the latest report, will be depleted in 2033, at which point the incoming cash “will be sufficient to pay 77 percent of scheduled benefits.”

***

The 2021 infrastructure bill instructed the FCC to prevent “digital discrimination” of broadband access “based on income level, race, ethnicity, color, religion, or national origin.” While the statutory language is broad, the agency’s proposed rule stretches it further to force broadband providers to prioritize identity politics.

***


Surveys

In America today, is there too much individual freedom or too much government control?
To curb climate change, should gas, meat, and electricity be strictly rationed?
Are your personal finances getting better or worse?
Can government be trusted to do the right thing most of the time?

These are questions from pollster Scott Rasmussen and here are some of his results (from Jacoby)

"In [Scott] Rasmussen’s general surveys, about 16 percent of respondents said there is too much individual freedom, while 57 percent said there is too much government control. But among the polled elites, three times as many (47 percent) believed there is too much freedom. Just 1 in 5 responded that there is too much control.

Strict rationing of gas, meat, and electricity? In broad-based surveys, 63 percent opposed rationing and 28 percent approved. When elites were surveyed, on the other hand, the results flipped: Fully 77 percent favored rationing, while only 22 percent said they were opposed.

…..

Decades later, Rasmussen’s data suggest that the arrogance of such elites remains entrenched. In America they see a nation where people have too much freedom and should be told what to do by a government that knows best. Recounting a presentation he gave at Harvard a dozen years ago, Rasmussen tells me he has never forgotten one faculty member who demanded in exasperation: “Why won’t Americans let us lead? It’s what we were trained to do.” You don’t have to scrutinize poll numbers to recognize the impact of that attitude on America’s civic life. Too many elites look down on their fellow citizens, and an awful lot of their fellow citizens return the favor." 

Wednesday, January 3, 2024

Some China Numbers


Some China Numbers

Anyone familiar with Zeihan will understand the potential implications of China's recent population statistics. The world is changing. Its makeup will be different. Policies, alliances, and philosophies will not be the same. 
Zeihan argues that the survival of a nation depends upon three basic national functions: It must be able to reproduce its population, feed it from within, and independently provide it with energy. According to him, only five current nations can do that: Canada, the U.S., Mexico, Argentina, and Turkey. None of the other nations will be able to withstand the pressures of their deficits and will have to change in some accommodating way. Some, like Germany and Italy, will simply disappear.
Here are some new China numbers.

                                                #

While official figures won't be confirmed until Jan. 17, the Mother and Infant Daily news service said 7.88 million babies were born across China 2023, 1.68 million fewer than in 2022.

Given that 11 million people died this year, China's population has therefore fallen by 3.12 million, the population of a medium-sized Chinese city, the report said, citing the City Data account on Baidu's Tieba forum site.

Authorities in Hangzhou, Zhengzhou, and other major cities with populations in the tens of millions, are promising cash subsidies for new families, with the Wuhan Donghu High-tech Zone offering 60,000 yuan (US$8,400) per child, the highest known rate so far, according to recent media reports.

Meanwhile, the number of Chinese couples marrying for the first time has fallen by nearly 56% over the past nine years, the financial magazine Yicai quoted the 2023 China Statistical Yearbook as saying, with such marriages numbering less than 11 million in 2022.

In 2022, China's National Bureau of Statistics reported a drop in population of around 850,000 to 1.41175 billion, the first fall since 1961, the last year of China's Great Famine.

ENG_CHN_FallingBirths_12272023.2.png


Saturday, April 15, 2023

SatStats: Birth Rates

The FBI infiltrated a Catholic church congregation in Virginia.

***

Renewable subsidies have distorted and destabilized the Texas electric grid, which resulted in a week-long power outage during the February 2021 freeze. To prevent more blackouts, Republicans in the Lone Star State now plan to subsidize gas power plants.
The Texas Senate last week passed putative energy reforms to “level the playing field,” as Lt. Gov. Dan Patrick put it. Texans will now spend tens of billions of dollars to bolster natural-gas plants that provide reliable power but can’t make money because of competition from subsidized renewable energy.


***

The least advantaged in market societies are better off than the least advantaged in nonmarket societies and may be better off than the most well-off in some nonmarket societies. This material fact, we argue, is of moral significance.--Storr and Choi


SatStats: Birth Rates 

The nations of the world are under significant demographic pressure. The most vulnerable are said to be Germany, Italy, and China. There are implications regarding identity, workforce, and the modern state's strange notion that current promises can be paid for by subsequent generations. This is culled from The Daily Mail.

A baby boom in the mid-20th century saw the average woman give birth to between three and four children. Today, just 1.6 children - the lowest level recorded since data was first tracked in 1800.

Dr Melissa Kearney, an economic professor at the University of Maryland, told DailyMail.com: 'There has been a greater emphasis on spending time building careers. Adults are changing their attitudes toward having kids.'They are choosing to spend money and time in different ways... [that] are coming into conflict with parenting.' She continued that younger people are also showing more interest in leisure activities and travel now than they did before, on top of career building.'[Wanting to travel] just comes into conflict with parenting,' she said.

This could lead to economic devastation in America down the line - as the federal government would need to collect more taxes to fund programs such as Medicare and Social Security - while dishing out fewer benefits to each person.

Fertility in the US has long been falling. A half-century ago in 1970, the average woman was having 2.39 children over her entire life span.

In 1920 - a full century ago - the rate was at 3.17. The earliest available data from 1800 puts the rate at 7.04. The Census Bureau predicts there will be 94.7 million Americans over the age of 65 by 2060, accounting for 23 percent of the nation's population. In 2020, the most recent Census, 56 million Americans were over 65 - accounting for just 17 percent of the population. A half-century ago in 1970, seniors made up around 10 percent of the US population.

Scandinavian countries such as Sweden (fertility rate of 1.6) and Norway (1.5), which have strong welfare states also suffer from a declining birth rate.

Men are now having their first child at 26.4 years old on average, while women are giving birth for the first time at 23.7. Both have increased greatly in the last two decades

Men are now having their first child at 26.4 years old on average, while women are giving birth for the first time at 23.7. Both have increased greatly in the last two decades


The number of American women with at least one child has fallen to just 52.1 percent, while the number of men dropped to 39.7 percent in 2019

Estimates are that the American population will start to decline in 2035.


Saturday, October 22, 2022

Diogenes' Carbon-Free Lantern/Statistics


The Roman Republic failed when its government switched from managing the people in the country to managing the other people in the room.--Chris

***

The WSJ reports that 75% of Americans 17 to 24 are ineligible for military service because of obesity, addiction, or criminal history.

***

In the United States, 20,000 people die of heat, but 170,000 die of cold. So, could the launching of reflective devices to cool the earth be considered a crime against humanity?

***

Julian Assange speaking in 2011: "The goal is to use Afghanistan to wash money out of the tax bases of the US and Europe through Afghanistan and back into the hands of a transnational security elite. The goal is an endless war, not a successful war"

***

The words Black and Indigenous are both capitalized now. Is white? If not, why?

***

Several research articles co-authored by Nobel-prizewinning geneticist Gregg Semenza are being investigated by publishers after internet sleuths raised concerns about the integrity of images in the papers. Journals have already retracted, corrected or expressed concerns about 17 papers over the past decade, and others are investigating image- and data-integrity issues in further studies.

***

Diogenes' Carbon-Free Lantern/Statistics

Sometimes large questions are confounded by small ones. But small problems require effort and diligence. And, of course, an interest in the truth, which recently has become cultish.

The entire U.S. generated only 163,703 thousand megawatt hours of electricity from utility solar power in 2021, according to data from the U.S. Energy Information Administration, while employing 255,037 workers in the industry, according to the National Solar Jobs Census. In contrast, nuclear power generated 778,152 thousand megawatt hours of electricity while employing 66,800 workers, according to the U.S. Department of Energy.

So each solar worker generated only 640-megawatt hours of electricity (enough to power 57 homes), while each nuclear-power-industry employee generated 11,648-megawatt hours of electricity (enough to power 1,059 homes), making the average nuclear employee 18.2 times as productive at generating carbon dioxide–free electricity as the average solar employee.

There are a lot of suppositions in the climate harangue, and, sadly, there are some realities.


Wednesday, February 16, 2022

Murray and Murder


P J O'Rourk has died.

The Durham accusation is serious, but is it deep?

                         
Murray and Murder

In his new book, Charles Murray reviews the database for New York City murders and finds that of the 1,906 blacks killed from 2006-2017, 89 percent were killed by African Americans. Latinos committed 10 percent of these murders, and just 0.6 percent of black homicide victims died at the hands of whites. These figures, Murray writes, are “useful as a counterweight to much of the rhetoric from the Black Lives Matter movement.”

The problem with this kind of logical criticism is that it assumes the sincerity of its opponents.

Saturday, February 5, 2022

SatStats

SatStats

Ours is a culture obsessed with disparities. What about these and what should be done?

From Thomas G. Mortenson, senior scholar at the Pell Institute for the Study of Opportunity in Higher Education in Washington, D.C., updated.

Birth and Death (20)
For every 100 girl babies who die in the first 27 days of life 127.5 boy babies die.
For every 100 girl babies who die after the first 27 days but in the first year of life 130 boy babies die.
For every 100 infant girls who die under one year old, 128 infant boys die.
For every 100 girls ages 1 to 4 years who die 141 boys die.
For every 100 girls ages 5 to 14 years who die 130 boys die.
For every 100 girls and women ages 15 to 24 years who die 270 boys and men die.
For every 100 women ages 25 to 34 who die 227 men die.
For every 100 women ages 35 to 44 who die 177 men die.
Source: Centers for Disease Control and Prevention, National Center for Health Statistics

For every 100 women who die by opioid overdose, 227 men die.
Source: Kaiser Family Foundation

For every 100 female deaths attributable to alcohol worldwide, there are 329 male deaths.
Source: National Institute on Alcohol Abuse and Alcoholism, National Institutes of Health

For every 100 women who die on the job, 1,118 men die working.
Source: Bureau of Labor Statistics

For every 100 females ages 15 to 19 who commit suicide there are 293 males.
Source: Centers for Disease Control

For every 100 females ages 20 to 24 who commit suicide there are 464 males.
Source: Centers for Disease Control

For every 100 females ages 25-29 who commit suicide there are 418 males.
Source: Centers for Disease Control

For every 100 females ages 15-19 who die of homicide, there are 642 males.
Source: Centers for Disease Control

For every 100 females ages 20-24 who die of homicide, there are 717 males.
Source: Centers for Disease Control

For every 100 females ages 25-29 who die of homicide, there are 579 males.
Source: Centers for Disease Control

For every 100 females ages 30-34 who die of homicide, there are 488 males.
Source: Centers for Disease Control

For every 100 female military personnel who have died during Operation Enduring Freedom, 4,506 men have died.
Source: Congressional Research Service

For every 100 female military personnel who have died during Operation Iraqi Freedom, 3,915 men have died.
Source: Congressional Research Service

Don't those numbers look like a crisis? 

Saturday, March 27, 2021

Stats and Graphs


                                                     Stats  and Graphs

Travel as an economic marker:


This graph is surprising, not at all what you would expect historically or from the public discussion.


Michigan's service industry has been hit hard by the government response to the Virus. Would a terrorist threat be worse?


At a Monday White House press conference, Jill Biden’s chief of staff Julissa Reynoso made the claim that “A year into COVID-19, it is clear that women have been disproportionately impacted by the combined public health crisis and ensuing economic crisis….”


They just say stuff.


Saturday, January 23, 2021

Survey

                                                              Survey

A recent poll--funded by a conservative group but done by a presumed objective polling organization--turned up some interesting observations. They stratified the answers by voting tendencies.

Question: The average U.S. household spends about $30,000 per year on food, housing, and clothing combined. If we broke down all combined federal, state, and local taxes to a per household cost, do you think this would amount to more or less than an average of $30,000 per household per year?

Correct Answer: More than $30,000. In 2018, federal, state and local governments collected a combined total of $5.1 trillion in taxes or an average of $40,000 for every household in the U.S.

Correct answer given by 43% of all voters, 36% of Democrat voters, 47% of Trump voters, 42% of males, 44% of females, 51% of 18 to 34 year olds, 46% of 35 to 64 year olds, and 38% of 65+ year olds.

Question: On average, who would you say pays a greater portion of their income in federal taxes: The middle class or the upper 1% of income earners?

Correct Answer: The upper 1%. The Congressional Budget Office, the U.S. Treasury, and the Tax Policy Center have all documented that households in the top 1% of income pay an average effective federal tax rate of about 33%, while middle-income households pay about 13%. These tax rates account for nearly all income and federal taxes.  

Correct answer given by 18% of all voters, 6% of Democrat voters, 30% of Trump voters, 21% of males, 15% of females, 11% of 18 to 34 year olds, 19% of 35 to 64 year olds, and 19% of 65+ year olds.


Question: Now, suppose we broke down all government spending to a per household cost—do you think the combined spending of federal, state and local governments amounts to more or less than $40,000 per household per year?

Correct Answer: More than $40,000. In 2018, federal, state and local governments spent a combined total of $6.9 trillion, or an average of about $54,000 for every household in the United States. For reference, the average U.S. household spends about $45,000 per year on food, housing, clothing, transportation, and healthcare combined.

Correct answer given by 48% of all voters, 44% of Democrat voters, 53% of Trump voters, 53% of males, 43% of females, 53% of 18 to 34 year olds, 52% of 35 to 64 year olds, and 43% of 65+ year olds.

Question: Do you think the federal government spends more money on social programs, such as Medicare, education, and food stamps—or does the federal government spend more money on national defense, such as the Army, Navy, and missile defense?

Correct Answer: Social programs. In 2018, 62% of federal spending was for social programs, and 18% was for national defense. In 1960, the opposite was true, and 53% of federal spending was for national defense, while 21% was for social programs.  

Correct answer given by 36% of all voters, 14% of Democrat voters, 59% of Trump voters, 40% of males, 33% of females, 23% of 18 to 34 year olds, 36% of 35 to 64 year olds, and 41% of 65+ year olds.

Saturday, January 9, 2021

Graphs


                                                              Graphs

Higher education spending. From 1959 to 2018, inflation-adjusted government spending on higher education rose from $3,614 per student per year to $10,474. This doesn’t include additional government funding for university research, university hospitals, and student loans:

Inflation-Adjusted Government Spending Per Higher Education Student


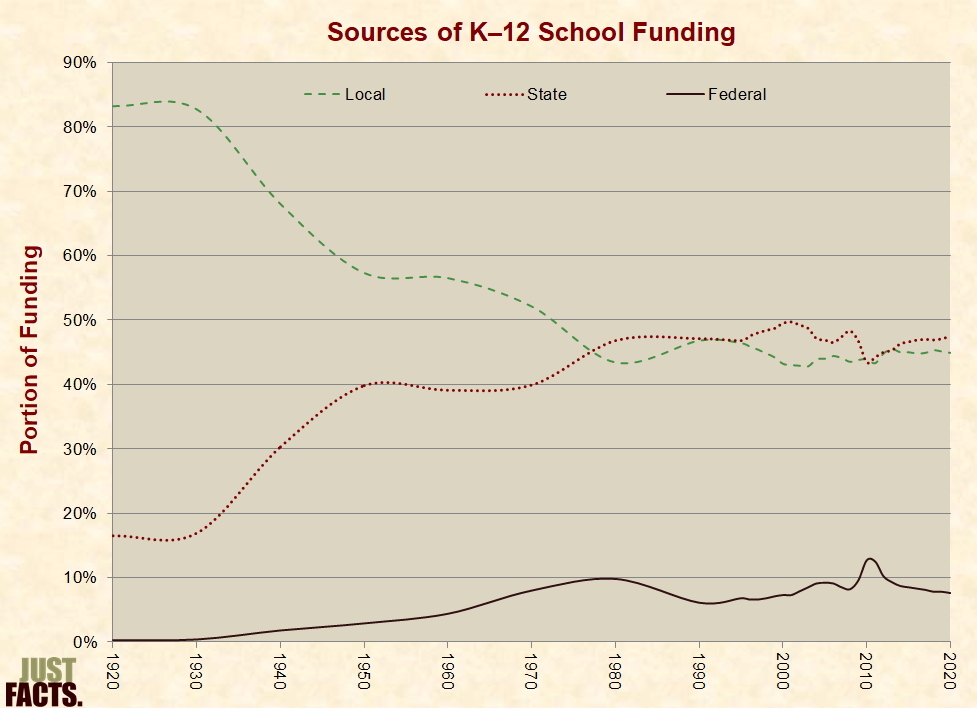
 This is interesting. Between 1920 and 2017, the portion of K–12 public school funding provided by:

  • local governments decreased from 83% to 45%.
  • state governments increased from 16% to 47%.
  • the federal government increased from 0.3% to 8%.
Sources of K�12 School Funding


 Whatever problems the educational system is having, money does not seem to be one of them. With a couple of exceptions, the average inflation-adjusted spending per public school student has risen by 20% since 2000, 93% since 1980, 3.8 times since 1960, and 23 times since 1920:

Inflation-Adjusted Public School Spending Per Student


5 developed countries.

5 different policy responses to COVID.

5 different outcomes in their COVID death tolls.

5 nearly identical mobility patterns from March 1 - July 1.

Tell me again: what do lockdowns achieve?

No photo description available.

Friday, January 8, 2021

Populations and People

                                                            Populations and People

From Quillette:

No fewer than 23 leading nations—including Japan, Spain, South Korea, and Italy—will see their population cut in half by 2100. China’s will drop by a stunning 48 percent. . .

. . .Another 34 countries will see dramatic population declines by 25 to 50 percent by 2100. Beyond this, the projected fertility rates in 183 of 195 countries will not be high enough to maintain current populations by the century’s end. That is called negative population growth and once it starts, it probably won’t stop. These scholars predict that sub-Saharan and North Africa, as well as the Middle East, will be the only super regions fertile enough to maintain their populations without dramatic immigration policies.

The article refers to a Gates Foundation projection.

Professor Christopher Murray, director of the Institute for Health Metrics and Evaluation at the University of Washington’s School of Medicine and head of the Gates study, told the BBC, “I find people laugh it off… they can’t imagine it could be true, they think women will just decide to have more kids. If you can’t [find a solution] then eventually the species disappears.”

Tuesday, December 29, 2020

Minorities in the U.S.

                                                 Minorities in the U.S.

The anti-American mantra has some defects.


We are frequently told by commentators and theorists on the progressive and liberal Left that we live in a systemically racist and patriarchal society. The belief that Western societies privilege white men and oppress people of color, women, and LGBT citizens is especially popular within academic institutions, legacy media, the entertainment industry, and even sports. However, newly released statistics from the US Department of Labor for the third quarter of 2020 undermine this narrative. Asian women have now surpassed white men in weekly earnings. That trend has been consistent throughout this past year—an unprecedented outcome.

According to the latest data from the US Census Bureau, over the 12 months covered by the survey, the median household incomes of Syrian Americans ($74,047), Korean Americans ($76,674), Indonesian Americans ($93,501), Taiwanese Americans ($102,405), and Filipino Americans ($100,273) are all significantly higher than that of whites ($69,823).

The latest Census data indicate that the median earnings for full-time, year-round female Palestinian American workers ($52,061), female Iranian American workers ($64,220), and female Turkish American workers ($67,759) were all higher than those of white women ($45,581). Turkish and Iranian women also out-earned white men ($57,003).
From Arora

So, what does all this grousing really mean?

Wednesday, November 18, 2020

Numbers and Viruses


                       Numbers and Viruses

“BIDEN CALLS FOR UNITED FRONT AS VIRUS RAGES.”-NYT

Rages.
It seems Penn State, much like U.S. universities in all 50 states, has an aggressive coronavirus testing program as a way of keeping close track of the virus’s spread on campus.

Please think about the fact that testing for the coronavirus in what is the world’s richest country is increasingly very convenient, and free. Please think about it relative to March and April when tests weren’t anywhere close to this accessible. Not too long ago a quick coronavirus test in the United States cost a privileged subject $400 and above, but in November of 2020 it’s more and more the case that the tests can be had for nothing.

From there, let’s travel to Indonesia on the other side of the world. This country can claim 270 million citizens versus roughly 330 million in the United States. Where it gets interesting is that according to a recent report in the Wall Street Journal, Indonesia has reported 11,000 deaths related to the coronavirus versus nearly 240,000 in the U.S.

Indonesia, it would be fascinating to witness the perpetually alarmed explain the low number of “coronavirus deaths” there. Are Indonesians genetically immune to infection from the virus, do they religiously wear N-95 masks while studiously avoiding touching their faces, do they have their own “genius” Dr. Fauci equivalent whose gameplan has been brilliantly embraced by President Joko Widodo, or is it possible that Indonesia has a low death count precisely because it has a low testing rate?

You see, according to the Journal, testing in Indonesia has been very rare. 8 per 1,000 inhabitants kind of rare. Keep in mind that Mexico can claim 13 tests per 1,000 and even the Philippines can point to roughly 30 per 1,000. (from Tamney)

Saturday, September 26, 2020

Stats


                                                                       Stats


An interesting--if unflattering--way of looking at the damage done by the Virus:


Saturday, September 12, 2020

Stats and Lowry


                            Stats and Lowry

A regular NBA game has about 90 shots per team, or 180 all together. Let’s say, generously, each shot takes about two seconds (a period of time that also includes almost every rebound and assist too). That’s 360 seconds, or a nice tidy six minutes, that overwhelm the box score. Those six minutes make almost every highlight, GIF, and meme from the sport. The players who excel in those six minutes make the most money, have the biggest endorsement deals, and are must-gets for your fantasy team. 

Meanwhile, two teams x five players x 48 minutes means a game is 480 minutes of work. Six minutes is 1.25 percent of the time. That massive 98.75 percent of the game is “little things.” 

From an article on Kyle Lowry that argues this:

In this year’s playoffs, we’ve seen a tale of two Raptors: the team with Kyle Lowry and the team without. If you watch every second Lowry has been on the floor, you’ll see a Toronto cakewalk. They have a shot at a title outscoring opponents by eight points per 100 possessions. If, on the other hand, you watch the minutes Lowry has been on the bench, it’s just about a tie, and the Raptors are not elite at all.

This might be surprising for a player who—when you mash his box-score stats together into PER, emerges as the 57th best player in the NBA this season (somewhere beneath Marquese Chriss, D’Angelo Russell, and Dwight Howard). It’s less surprising if you look at any team-performance based stat. Real Plus-Minus ranks 400 or so NBA players every season. This year, Lowry finished sixth overall, ahead of players like Kawhi Leonard, Luka Doncic, Jayson Tatum, Joel Embiid, Damian Lillard, Jimmy Butler, and Anthony Davis. And it’s no outlier. By that same measure, Lowry’s average finish over the last five years had been fourth in the entire league.

The thing is, we tend to measure basketball performance with things we are used to tracking, like points and rebounds. Kyle Lowry is OK at those things, and was great in Game 6. But if he’s a top five or 10 NBA player at winning, while being only OK at those easy-to-measure things … he must be a genius at the other things, which we often mistakenly call little things.

Saturday, August 1, 2020

stats


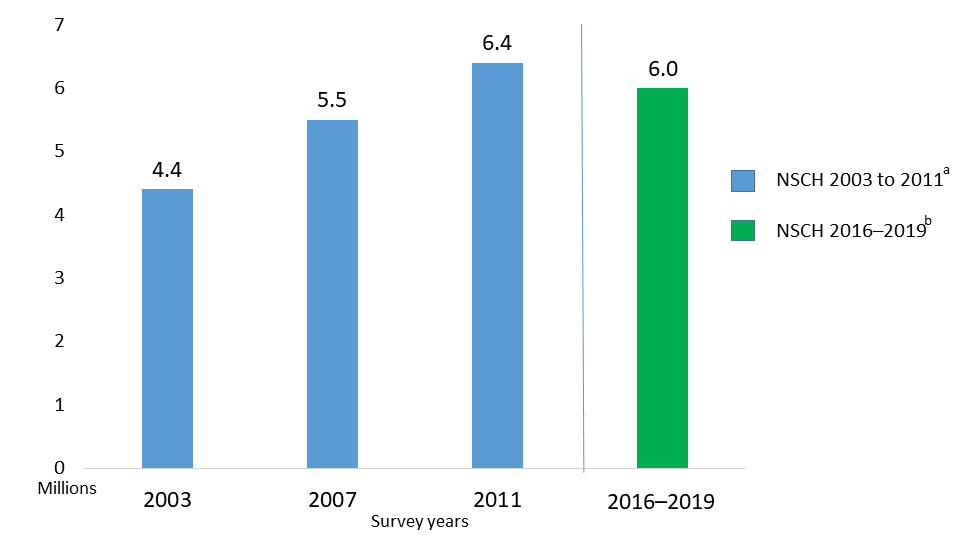
The number of US children ever diagnosed with ADHD has changed over time
Estimated number of US children who ever had a diagnosis of ADHD

The estimated number of children ever diagnosed with ADHD in millions is as follows.  National survey of children's health (NSCH), version 2003-2011:  4.4 million in 2007; 5.4 million in 2007; 6.4 million in 2011 National survey of children's health, version 2016:  6.1 million in 2016


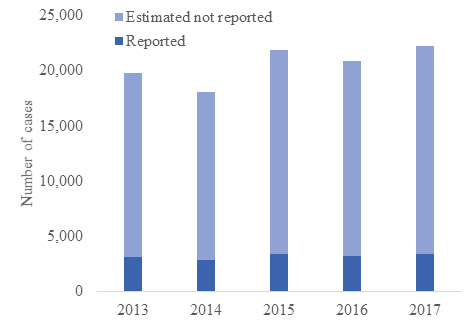
Figure 3.1Actual number of acute hepatitis B cases submitted to CDC by states and estimated* number of acute hepatitis B cases — United States, 2013–2017.
Bar chart for years 2013 through 2017. Y axis has number of cases, ranging from 0 to 25,000