Graphs
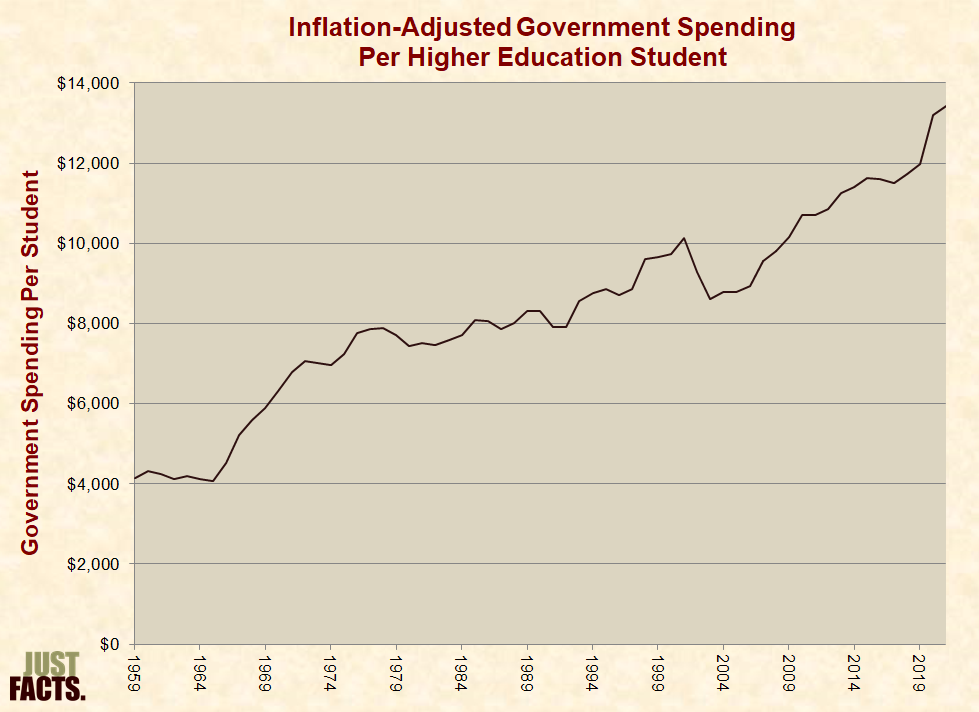
Higher education spending. From 1959 to 2018, inflation-adjusted government spending on higher education rose from $3,614 per student per year to $10,474. This doesn’t include additional government funding for university research, university hospitals, and student loans:
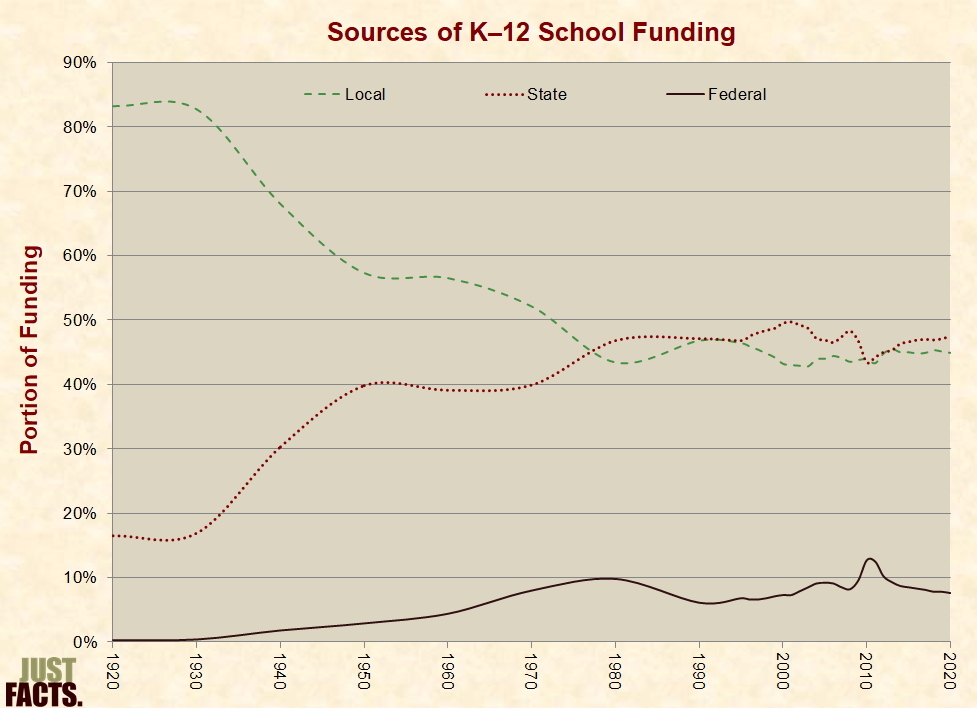
This is interesting. Between 1920 and 2017, the portion of K–12 public school funding provided by:
- local governments decreased from 83% to 45%.
- state governments increased from 16% to 47%.
- the federal government increased from 0.3% to 8%.
Whatever problems the educational system is having, money does not seem to be one of them. With a couple of exceptions, the average inflation-adjusted spending per public school student has risen by 20% since 2000, 93% since 1980, 3.8 times since 1960, and 23 times since 1920:

5 developed countries.
5 different policy responses to COVID.
5 different outcomes in their COVID death tolls.
5 nearly identical mobility patterns from March 1 - July 1.
Tell me again: what do lockdowns achieve?

No comments:
Post a Comment