Stats

Combined with World Bank data for the same year, these datasets show that the poorest 20% of U.S. households have higher average consumption per person than the averages for all people in most nations of the OECD and Europe:

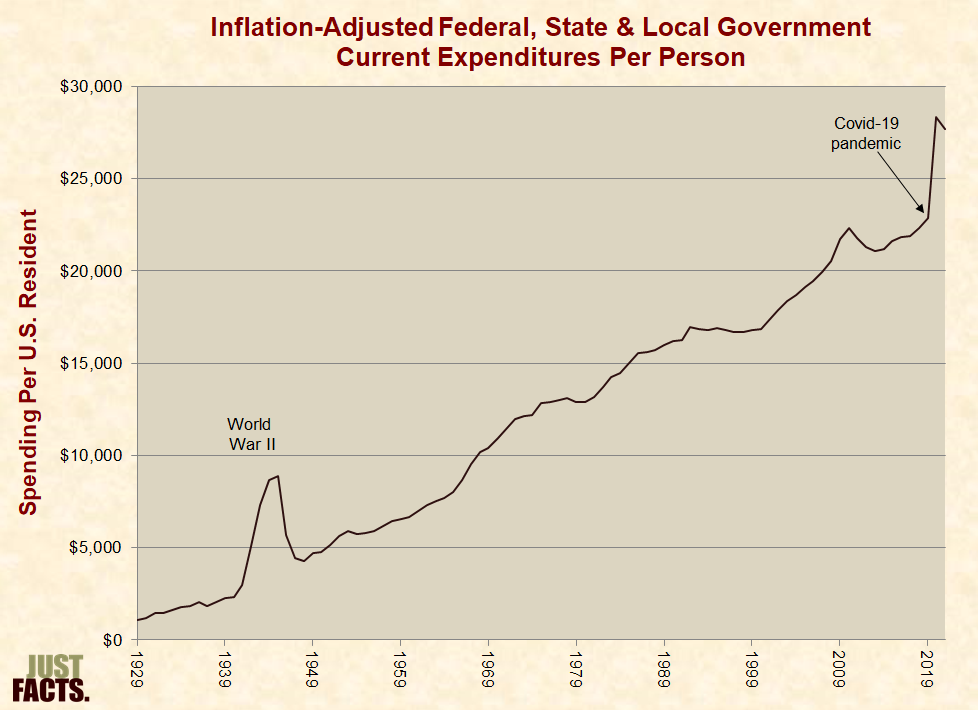
From 1929 to 2018, inflation-adjusted federal, state and local government current expenditures per U.S. resident ranged from $1,021 to $20,690 per year, with a median of $11,265 and an average of $10,664. In 2018, they were $20,566, or 93% above the average:
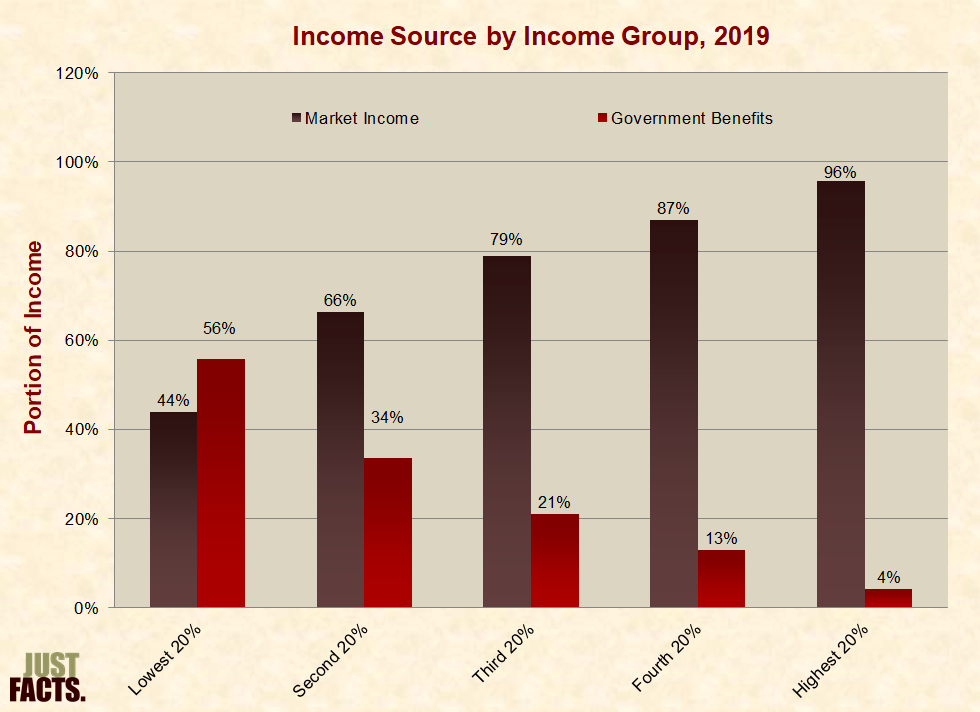
According to the Congressional Budget Office, U.S. households obtained about 85% of their income from the market and 15% from the government in 2016. This varied by income group on average as follows:
No comments:
Post a Comment